Alarms

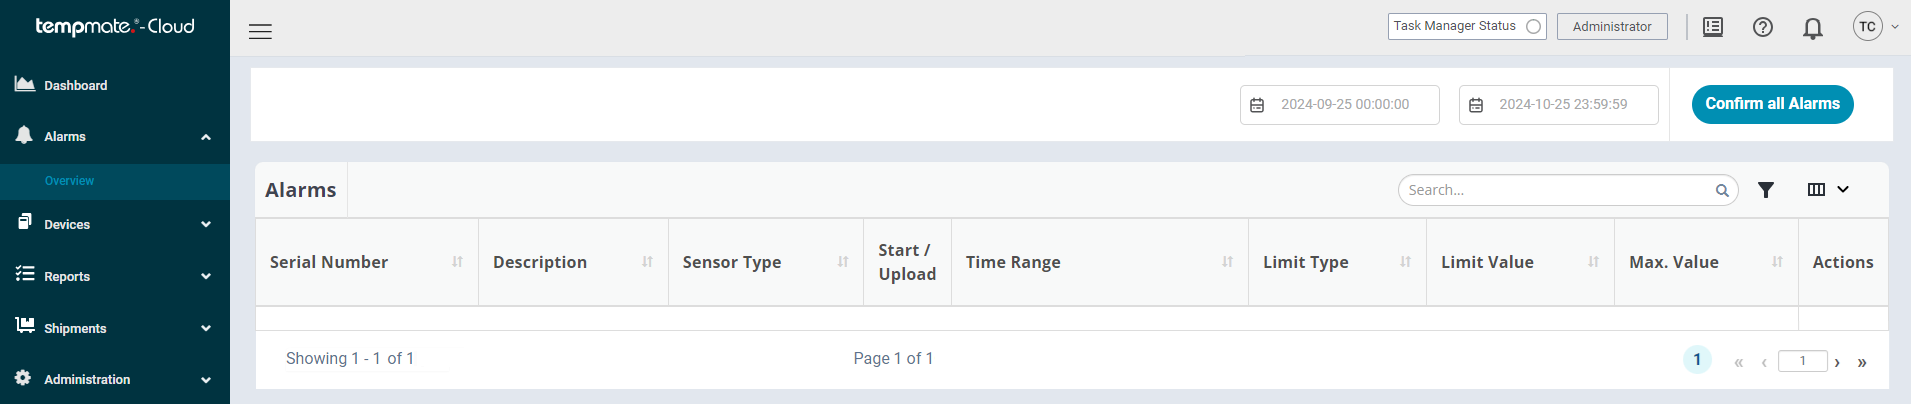
The Alarms tab presents all alarms that have been triggered by the data loggers belonging to the company profile. The overview also provides further information, such as

  • the sensor type that has exceeded the limit value
  • the time of the alarm
  • whether an upper or lower limit value was reached
  • information on the limit value itself
  • the maximum or minimum value measured during the trigger

Confirm Alarms

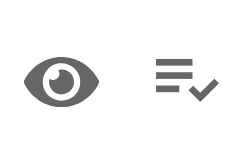
Two icons next to the alarms provide the option for further actions.

As on the dashboard, the view icon takes you to the Evaluation Page, where you can view detailed information about the device. The respective alarm messages are marked as “seen” with the confirmation icon. If only the eye icon is visible, the alarm has already been confirmed.
It is also possible to confirm all messages using the Confirm All Alarms button in the top right corner.

Filter and Table Settings

To narrow down the search for specific data loggers, it is possible to filter the device list.

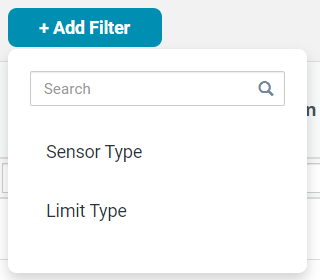
This is done by entering the keyword searched for or via the filter symbol. After clicking on the filter symbol, further filters can be added and applied using the Add New Filter button.

It is possible to restrict the list depending on the sensor type or the limit type from which the alarm was triggered.

For example, all data loggers for which the alarm was triggered by a lower temperature threshold should be displayed. We therefore set the following settings:

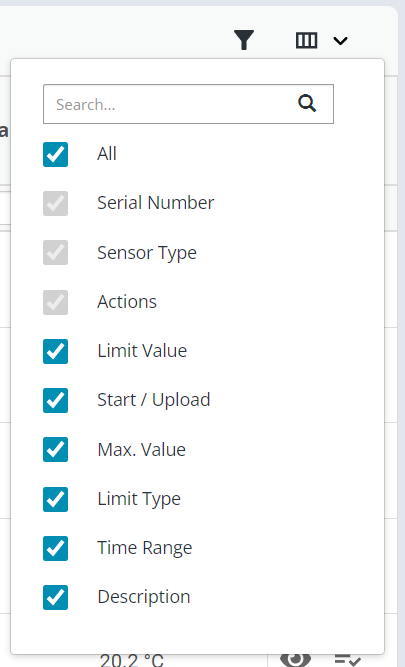
Next to the symbol for the filter settings is the menu for table configurations located.

Individual columns of the overview can either be hidden or added as required. By default, all columns are selected.

Happy 2026! Stay tuned to know what’s coming next

tempmate.®

Provide your email address to download the file

I'd like to download tempbase mac version software

protected with Google reCAPTCHA - Privacy